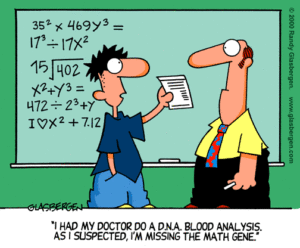
 This blog post is dedicated to every math and science teacher whose classes I never took seriously. I owe you all my sincerest apologies for not heeding your warnings when you told me, “You’ll use this someday!”
I was the kid in high school who doodled through math class, paying attention only enough to keep my GPA up for college scholarships.
“I’ll ever need this,” I argued, “I’m going to be a designer. Designers don’t need science, and they certainly don’t need math.”
I was so wrong. After just a few years working as a designer, I know the truth – math and science matter.
Leonardo da Vinci said, “Study the science of art, and the art of science.” Five hundred years later, I find da Vinci’s words define one of the most important emerging fields in web design – conversion optimization.
Conversion optimization focuses on how to turn prospects into clients. It depends on experimentation, correlations, and statistics (you know, that math and science stuff I’d never need) to determine which designs and the content will result in users following through with a specific call-to-action.
In my first design job, I immediately realized that a terrible design with a high conversion rate is way more useful to a client than a beautiful site with poor conversion optimization. The goal of conversion optimization is to find the sweet spot where a page can be beautiful and convert the most leads possible.
So, how do we achieve that? We first have to quantify the actions that users take. Most of the time, conversion optimization experts look at the “bounce rate” and “click-through rate.” The bounce rate represents the percentage of users who leave a site from the first page they arrived at without moving on to another page on the same site. Click-Through Rates are a little more focused. They represent the number of times someone follows through with a call-to-action (a click-through) vs. the number of times the call-to-action is seen (an impression).
Now that we have all the vocabulary, let’s take a look at an example…
On the WrightIMC website, there is a contact form for prospective clients. Let’s say we want to find out what would happen to our conversion rate if we changed the “submit” button from blue to red.
We would implement a split test where some users would see a red button while others would continue to see a blue button. Then we’d track the bounce rate and click-through-rate for these two versions over a set amount of time. After our test has gathered enough data, the results for the different designs would be reviewed. Then we implement the button with the highest rate of conversions full-time, with confidence we’ve made the right decision based on scientific results.
Voila, the effectiveness of design has been quantified.
My graphic design is enhanced – made more useful to clients – by coupling it with science and math. In short, I’m glad I was wrong.
(Photo credits to Randy Glasbergen.)
