Recently Microsoft’s search engine, Bing, ran a campaign much like the Pepsi Challenge where they claimed people who tried Bing like it more than Google with a 2:1 ratio. This didn’t really surprise me as I prefer Bing for some types of queries, such as local (they are the default search on my Google Android smartphone – per my choice), however, I was curious how well the campaign was really working for them.
The Bingiton campaign is designed to give users a ‘blind’ tasting of both Bing and Google simultaneously and let them pick one they like more when brands are not visible. It makes sense to copy the Pepsi test since it helped Pepsi grow their consumer share in supermarkets where consumers had freedom of choice and Bing is really the Pepsi of online search today.
Savvy internet users probably see right through the ‘blindness’ of the test because even though it displays only the search results, each search engine displays their results in a unique fashion, so if you’ve previously used either Google or Bing telling which is which wouldn’t be very difficult. Still, the claim of users picking Bing 2 to 1 over Google is intriguing and worth investigation.
The Bingiton campaign started getting mass press coverage on September 6th, 2012. It’s now been 2 weeks, which should have allowed enough time for people to give it a test and start switching to Bing. I took data from Google Analytics (irony) on traffic coming to websites that I have access to from September 6th to September 20th and compared that data to a similar period in August, August 17th – August 31st. The data shows a 7.94% increase in Bing traffic for all clients. Not an incredibly huge boost in traffic, it could just be that some clients experienced ranking gains in Bing during the current period compared to the previous one. Keep in mind this is only data from our clients/friends that we had the ability to look at.
I broke the data down further into some industry segments to see what the data looked like there. When this was done some of the segments showed reasonable gains that might be attributed to the campaign such as Environment, Marketing, Legal, Travel, and Health. The Marketing segment made sense to me as more marketers were likely checking which one they would pick and typed in queries related to marketing services etc… Bing may not even be worried if the campaign only nets them a percent increase or two in overall searches because of the widespread promotion it’s brought the brand itself.
Percentage Changes by Industry
- Environment (green, outdoors, etc..): 132.25%
- Marketing (and advertising, tools, etc..): 32.18%
- Legal (lawyers, civil, etc..): 16.66%
- Travel (aggregators, blogs, etc..): 6.40%
- Automotive (car dealers, auto reviews, etc..): 5.11%
- Health (doctors, dentist, mental health, etc..): 4.74%
- Technology (gaming, tech, communication, etc..): 2.86%
- Education (assistance, tutoring, etc..): 0.30%
- Vice (ecigarettes, beverages, etc..): -2.87%
- Transportation (trucking, logistics, etc..): -6.50%
- Home (landscaping, remodeling, etc..): -15.38%
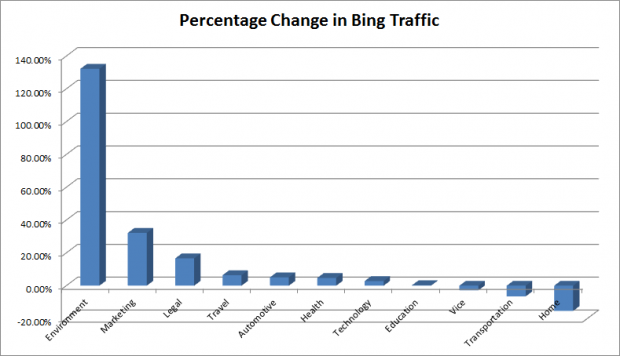
The changes in downstream traffic from Bing search engine since the bingiton campaign began broken down by various industry segments. Click image for larger view.
Note: the data is based on limited sample sizes. While the aggregate is quite large there are millions of websites on the internet and my sample may not represent the most accurate picture of how well the campaign is working. This is purely a non-scientific look at downstream traffic from Bing and should be used as such.